پەڕگە:IQ Distributions and Occupations.jpg
قەبارەی ئەم پێشبینینە: ٨٠٠ لە ٥٩٥ پیکسەڵ. ڕێزەلووشنەکانی تر: ٣٢٠ لە ٢٣٨ پیکسەڵ | ٦٤٠ لە ٤٧٦ پیکسەڵ | ١٬٠٢٨ لە ٧٦٥ پیکسەڵ.
پەڕگەی سەرەکی (١٬٠٢٨ × ٧٦٥ پیکسڵ، قەبارەی پەڕگە: ١٣١ کیلۆبایت، جۆری ئێم ئای ئێم ئی: image/jpeg)

|
This diagram image could be re-created using vector graphics as an SVG file. This has several advantages; see Commons:Media for cleanup for more information. If an SVG form of this image is available, please upload it and afterwards replace this template with
{{vector version available|new image name}}.
It is recommended to name the SVG file “IQ Distributions and Occupations.svg”—then the template Vector version available (or Vva) does not need the new image name parameter. |


کورتە
| وەسف |
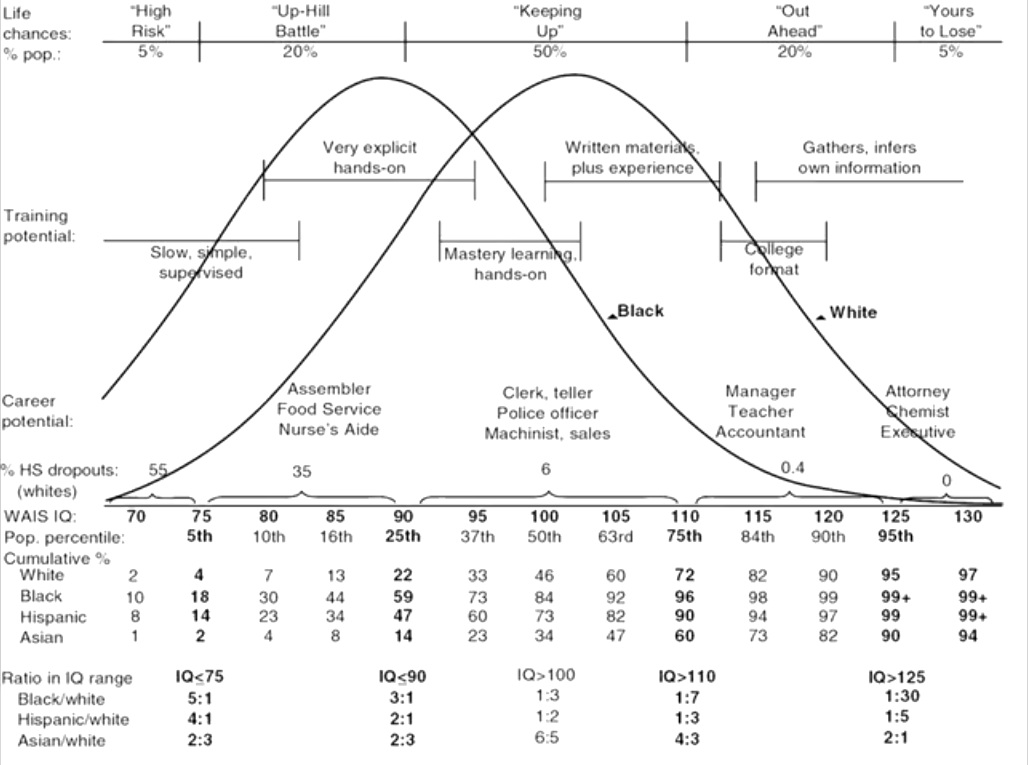
English: Life chances of young adults at different levels of the bell curve for general intelligence by race (Gottfredson, 2005a, figure 18.2). |
| ڕێکەوت | |
| سەرچاوە | Gottfredson, L. S. (2005a). Implications of cognitive differences for schooling within diverse societies. In C. L. Frisby & C. R. Reynolds (Eds.) Comprehensive handbook of multicultural school psychology (pp. 517–554). New York: Wiley. |
| بەرھەمھێنەر | Linda Gottfredson |
مۆڵەتنامە
This file is licensed under the Creative Commons Attribution 4.0 International license.
- تۆ ئازادی:
- بۆ بڵاکردنەوە – بۆ کۆپی کردن، دابەشکردن و دەستبەدەست ناردنی
- بۆ تێکەڵکردنەوە – بۆ سازاندنی کارەکە
- بەم مەرجانەی خوارەوە:
- دانەپاڵ – پێویستە باوەڕی گونجاو بدەیت، بەستەرێک بۆ مۆڵەتەکە دابین بکەیت و ئاماژە بەوە بکەیت کە ئایا گۆڕانکاری کراوە یان نا. دەتوانیت بە هەر شێوەیەکی گونجاو ئەوە بکەیت، بەڵام بە شێوەیەک نا کە وا دەربکەوێت کە مۆڵەتدەر پشتگیری تۆ یان بەکارهێنانەکەت بکات.
مێژووی پەڕگە
کرتە بکە لەسەر یەکێک لە ڕێکەوت/کاتەکان بۆ بینینی پەڕگەکە بەو شێوەی لەو کاتەدا بووە.
| ڕێکەوت/کات | ھێما | ئەندازە | بەکارھێنەر | تێبینی | |
|---|---|---|---|---|---|
| هەنووکە | ٠٥:١٥، ٣٠ی کانوونی دووەمی ٢٠٢١ | | ١٬٠٢٨ لە ٧٦٥ (١٣١ کیلۆبایت) | Nerd271 | Uploaded a work by Linda Gottfredson from Gottfredson, L. S. (2005a). Implications of cognitive differences for schooling within diverse societies. In C. L. Frisby & C. R. Reynolds (Eds.) Comprehensive handbook of multicultural school psychology (pp. 517–554). New York: Wiley. with UploadWizard |
بەکارھێنانی پەڕگە
ئەم پەڕەیە ئەم پەڕگەیە بەکار دەھێنێت:
بەکارھێنانی سەرانسەریی پەڕگە
ئەم ویکیانەی دیکەی خوارەوەش ئەم پەڕگە بەکاردێنن:
- بەکارھێنان لە uz.wikipedia.org