پەڕگە:High plains fresh groundwater usage 2000.svg

پەڕگەی سەرەکی (پەڕگەی SVG، بە ناو ٧٤٧ × ٩٤٦ پیکسەڵ، قەبارەی پەڕگە: ١٫٤٨ مێگابایت)
کورتە
| وەسف |
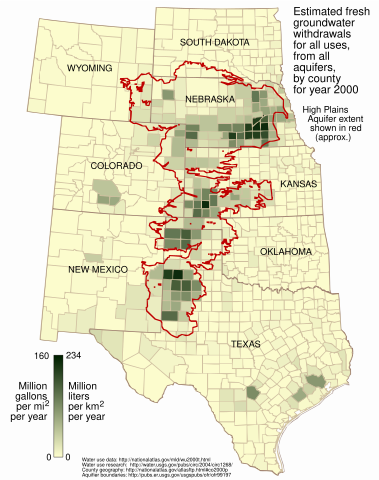
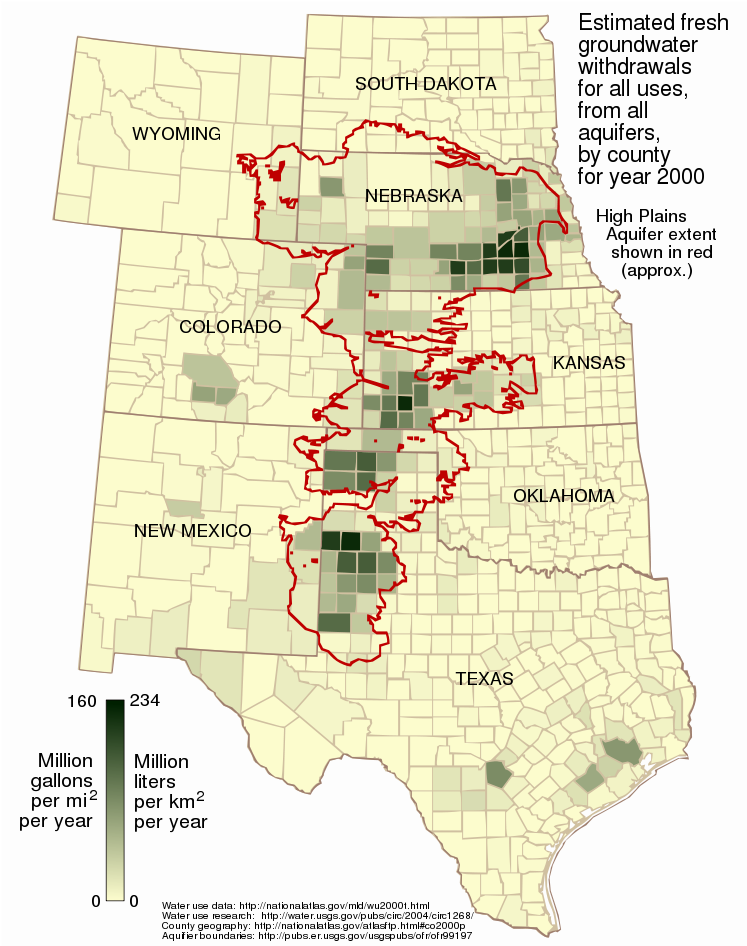
English: This map shows the estimated fresh water usage per square mile in the year 2000 for counties in the eight states underlain in part by the High Plains (Ogallala) Aquifer, presented as million gallons per square mile and million liters per square kilometer.
Usage is for all purposes -- public supply, industrial, irrigation, mining, livestock, and thermoelectric power -- from all underground sources, not just from the Ogallala Aquifer. Water usage data for the year 2000 was taken from the datafile wu2000t.dbf[1] from the US National Atlas[2]. Citation information from the metadata for that file:
Additionally:
The attribute used in this map is described:
The data is supplied as million gallons per day, by county. To arrive at an annual amount per square mile per year, the usage value from wu2000t.dbf was multiplied by 365 and divided by the number of square miles in the county as given in the 2000 county shapefile co2000p020 from the National Atlas:
Aquifer boundaries taken from Fischer and McGuire[3]. The map is presented in a Lambert azimuthal equal-area projection as used in the National Atlas (EPSG:2163[4]), the central meridian and latitude of which align nicely with the aquifer. |
| ڕێکەوت | |
| سەرچاوە | بەرھەمی خۆم |
| بەرھەمھێنەر | Kbh3rd |
| وەشانەکانی تر | File:Ogallala area freshwater ground withdrawals all aquifers.png |
مۆڵەتنامە
- تۆ ئازادی:
- بۆ بڵاکردنەوە – بۆ کۆپی کردن، دابەشکردن و دەستبەدەست ناردنی
- بۆ تێکەڵکردنەوە – بۆ سازاندنی کارەکە
- بەم مەرجانەی خوارەوە:
- دانەپاڵ – پێویستە باوەڕی گونجاو بدەیت، بەستەرێک بۆ مۆڵەتەکە دابین بکەیت و ئاماژە بەوە بکەیت کە ئایا گۆڕانکاری کراوە یان نا. دەتوانیت بە هەر شێوەیەکی گونجاو ئەوە بکەیت، بەڵام بە شێوەیەک نا کە وا دەربکەوێت کە مۆڵەتدەر پشتگیری تۆ یان بەکارهێنانەکەت بکات.
- بڵاوکردنەوەی گونجاو – ئەگەر لەسەر بنەمای ئەم کارە تێکەڵ، گۆڕان، یان ساز بکەی، پێویستە بەشدارییەکانت بە هەمان مۆڵەت یان هاوشێوەی مۆڵەتی ئەسڵی دابەش بکەی.
مێژووی پەڕگە
کرتە بکە لەسەر یەکێک لە ڕێکەوت/کاتەکان بۆ بینینی پەڕگەکە بەو شێوەی لەو کاتەدا بووە.
| ڕێکەوت/کات | ھێما | ئەندازە | بەکارھێنەر | تێبینی | |
|---|---|---|---|---|---|
| هەنووکە | ٢٣:١٣، ٩ی ئازاری ٢٠٠٩ | | ٧٤٧ لە ٩٤٦ (١٫٤٨ مێگابایت) | Kbh3rd | corrected metric conversion - see talk |
| ٠١:٢٨، ٣ی ئازاری ٢٠٠٩ |  | ٧٤٧ لە ٩٤٦ (١٫٤٨ مێگابایت) | Kbh3rd | The map said "acre" while the data, as noted on the image description page, correctly said "square mile". I have fixed that and made some minor esthetic adjustments of the state name locations. | |
| ٢٣:٤٠، ٢ی ئازاری ٢٠٠٩ |  | ٧٤٧ لە ٩٤٦ (١٫٤٨ مێگابایت) | Kbh3rd | {{Information |Description={{en|1=This map shows the estimated fresh water usage per square mile in the year 2000 for counties in the eight states underlain in part by the High Plains (Ogallala) Aquifer, presented as million milli |
بەکارھێنانی پەڕگە
ئەم پەڕەیە ئەم پەڕگەیە بەکار دەھێنێت:
بەکارھێنانی سەرانسەریی پەڕگە
ئەم ویکیانەی دیکەی خوارەوەش ئەم پەڕگە بەکاردێنن:
- بەکارھێنان لە ar.wikipedia.org
- بەکارھێنان لە ca.wikipedia.org
- بەکارھێنان لە en.wikipedia.org
- بەکارھێنان لە fy.wikipedia.org
- بەکارھێنان لە kk.wikipedia.org
- بەکارھێنان لە kw.wikipedia.org
- بەکارھێنان لە ml.wikipedia.org
- بەکارھێنان لە pt.wikipedia.org
- بەکارھێنان لە sr.wikipedia.org
- بەکارھێنان لە vi.wikipedia.org
- بەکارھێنان لە www.wikidata.org
- بەکارھێنان لە zh.wikipedia.org